Why is Building Pipelines Different from Software Development?

It Doesn’t Have to Be! Simplify Your CI/CD Workflow with Dagger
Introduction
CI/CD pipelines are essential for automating the process of software integration and deployment, ensuring that code changes are automatically tested, integrated, and deployed to production with minimal manual intervention or ideally in a fully automated way.
However, building and managing pipelines is not easy. In this blog, we will look into addressing some of the most common pinpoints of pipelines development and see how to improve.
This content will be valuable for Developers, Architects, DevOps Specialists, or anyone curious about how to improve building and maintaining CI/CD pipelines.
Challenges of building and running a CI/CD pipeline
The main challenge comes from the fact that CI/CD pipelines development and lifecycle management is treated differently from software development practices.
Nowadays, pipelines are mostly written in YAML. Large configuration files instruct pipeline runners hosted on services like GitLab or GitHub how to interpret a pipeline workflow file and what actions should happen.
👉 Read more about YAML file structure using Azure DevOps as an example.
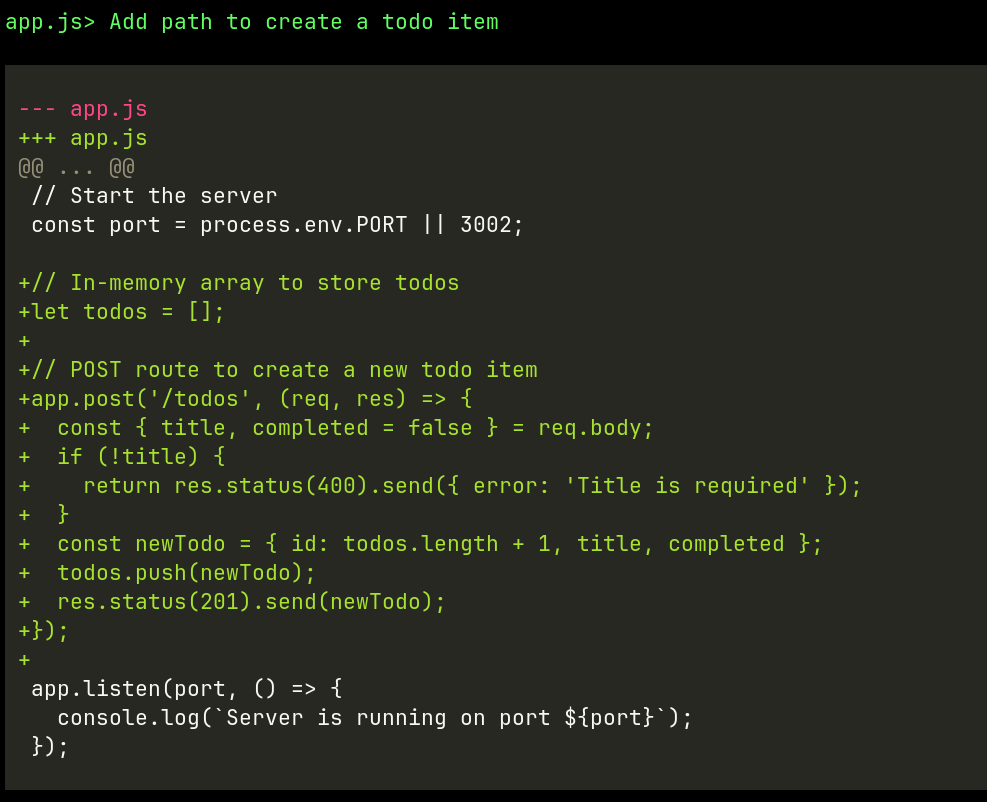
Individual actions are wrapped with YAML tasks or steps which are in
turn often bash scripts executed in the runner’s environment. Here is an
example build job with multiple steps. Actions are used to call
specialized steps and by default, the runner will execute commands
provided in the run block.
  build:
    runs-on: ubuntu-22.04
    steps:
      - name: Checkout
        uses: actions/checkout@v4

      - name: Setup Python
        uses: actions/setup-python@v5
        with:
          python-version: ${{ env.PYTHON_VERSION }}

      - name: Setup Hatch
        run: pipx install hatch==1.7.0

      - name: Set Default PyPI Project Version
        if: env.PYPI_VERSION == ''
        run: echo "PYPI_VERSION=v0.0.0+$(date -d@$(git show -s --format=%ct) +%Y%m%d%H%M%S)-$(git rev-parse --short=12 HEAD)" >> $GITHUB_ENV

      - name: Set PyPI Project Version
        run: hatch version ${{ env.PYPI_VERSION }}

      - name: Build Sdist and Wheel
        run: hatch build

      - name: Upload Sdist and Wheel to GitHub
        uses: actions/upload-artifact@v4
        with:
          name: dist
          path: "dist/*"
          if-no-files-found: error
          retention-days: 1
The main issue is that the commands can be executed locally, however there is no guarantee that the same commands will execute in the same way in the runner’s environment.
In other words, we cannot guarantee fully reproducibility of the pipeline.
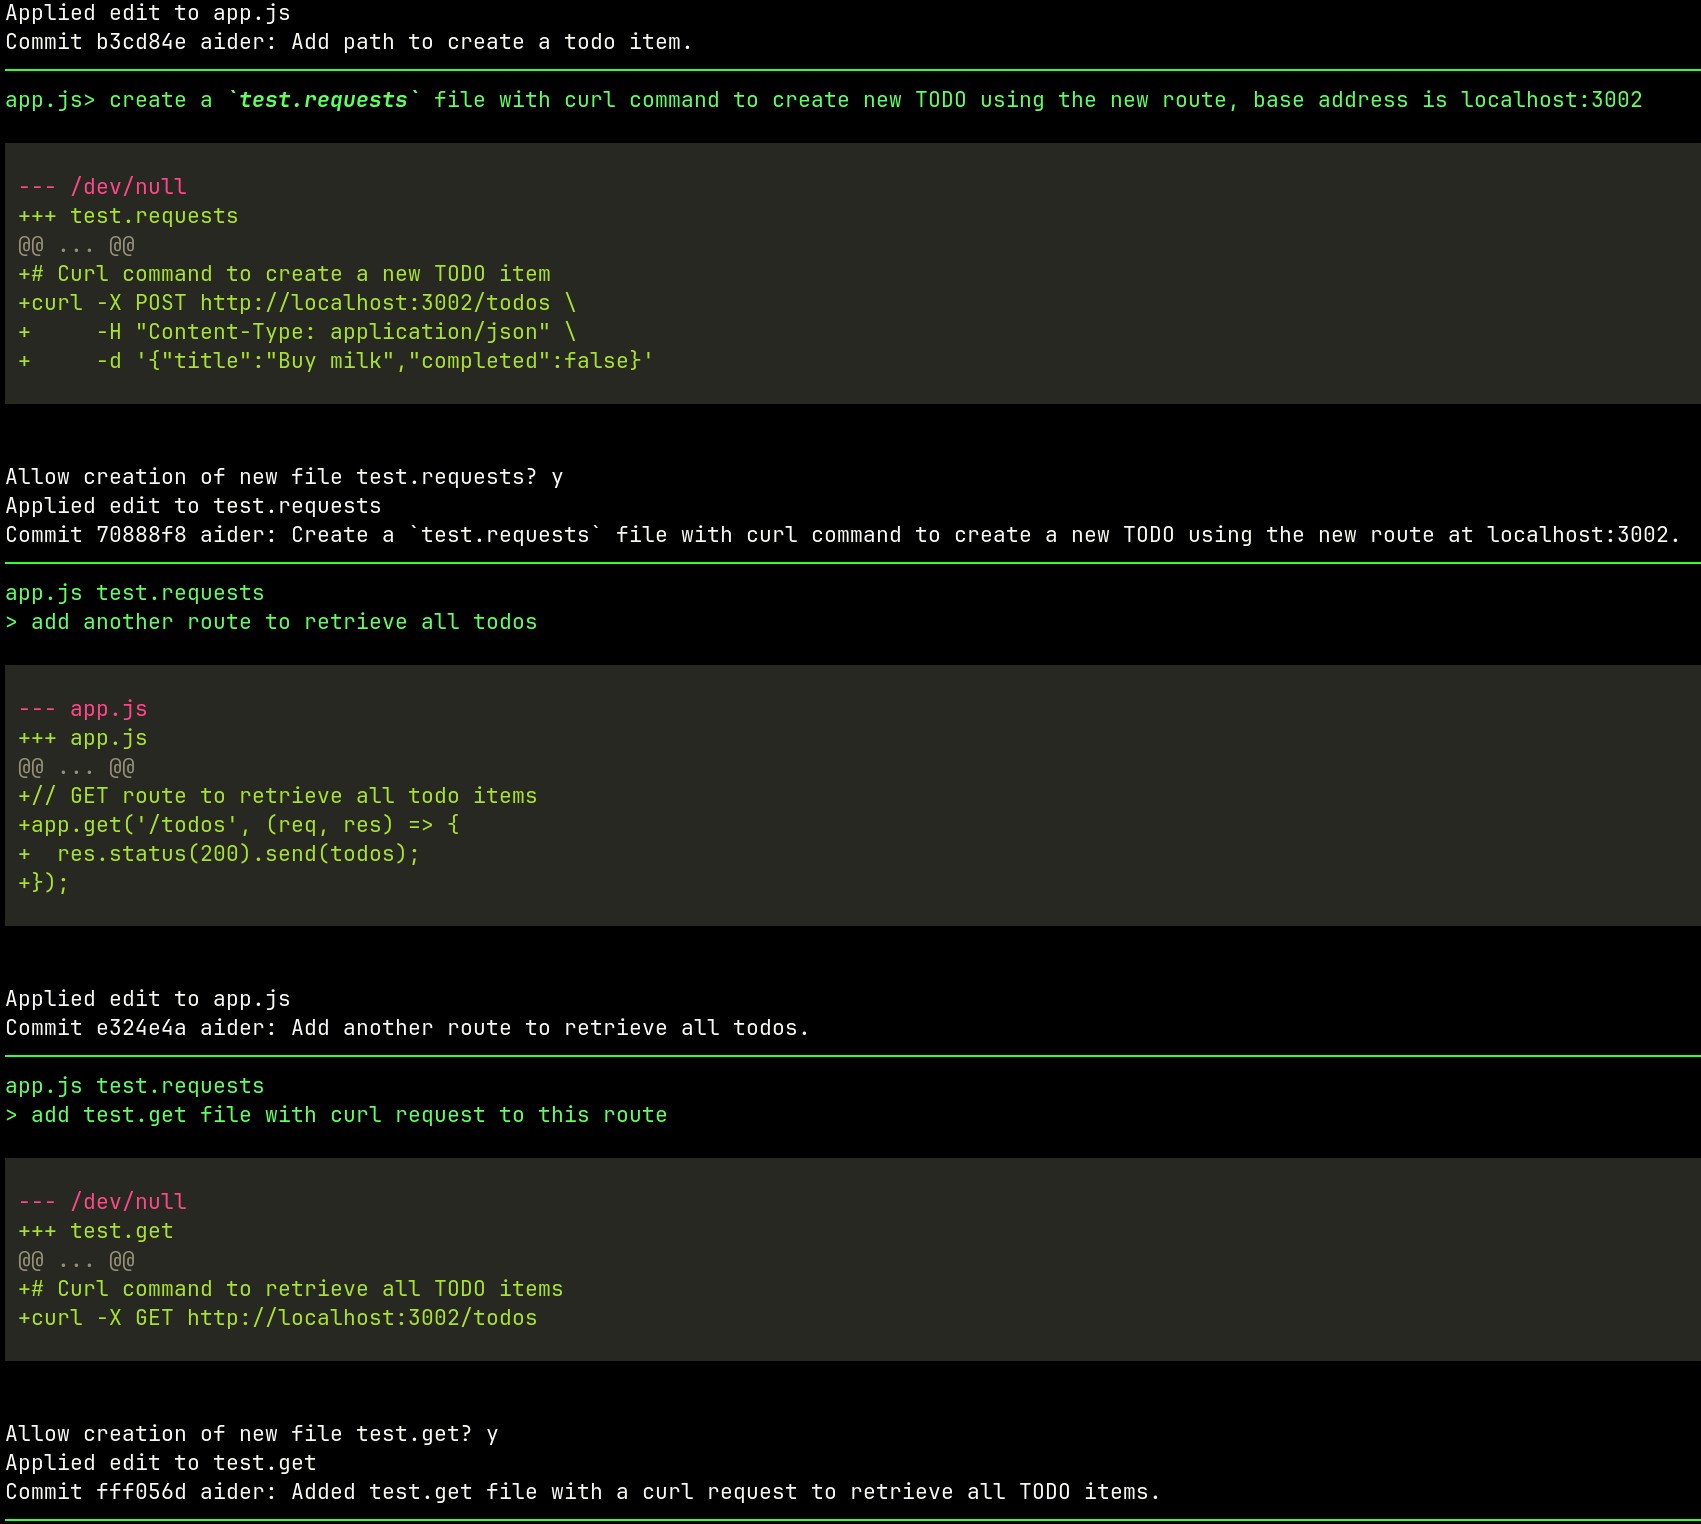
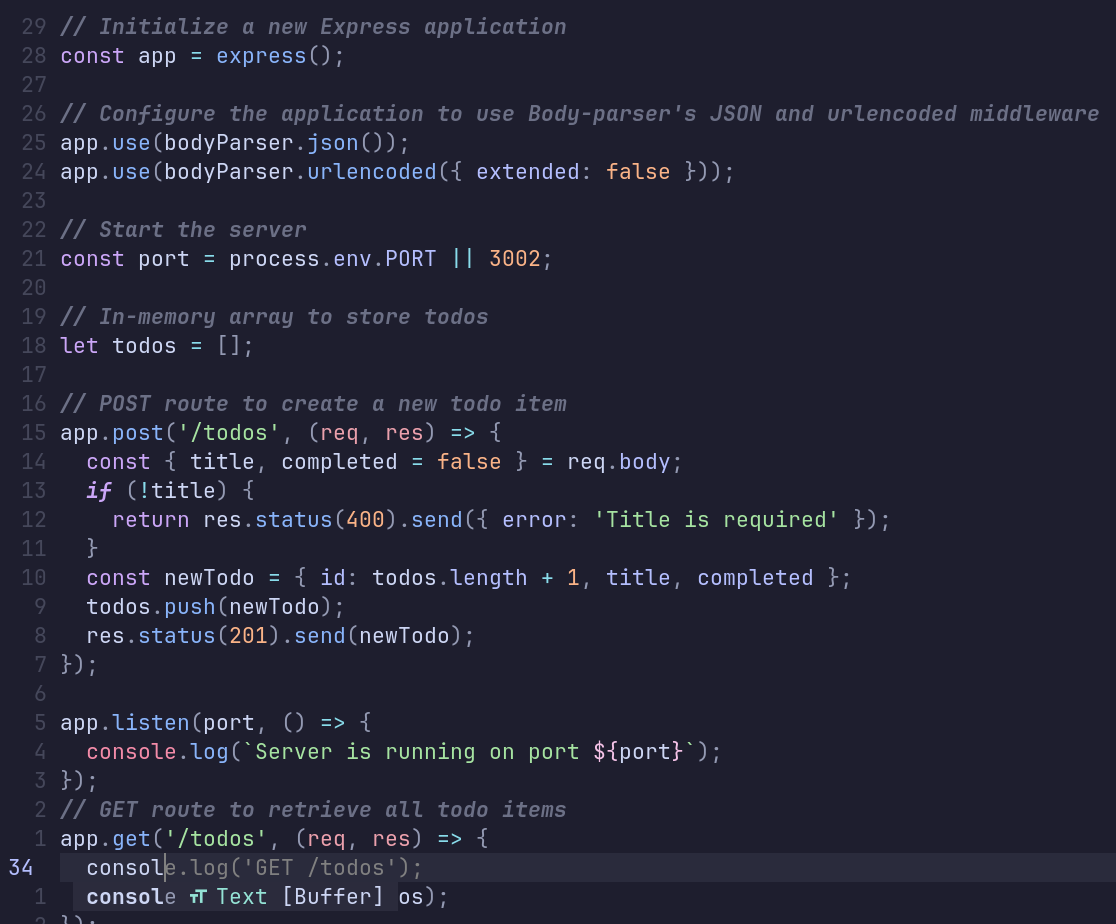
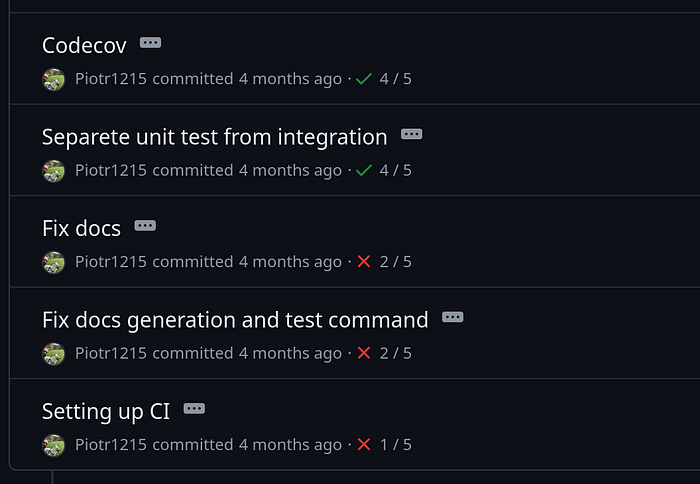
Since reproducibility does not work, testing happens in the runner’s environment. The only way to debug the workflow is to add print statements or log to a file and dig in the runner’s log file to see what went wrong (spoiler alert, most of the time it’s missing comma or something equally trivial).
This typically results in commit history like this where pipeline doesn’t work but the only way to be sure it will work is to let it run and check errors.
What if pipelines could be… just code
Good news is that they can! Pipelines can be just code working in a
standardized way, who knows maybe even using docker under the hood,
but more on that later.
Why would we want pipelines to be written in a programming language?
- creating and running tests with actual testing frameworks
- locally debugging and testing each pipeline step
- pipeline code versioning and releases
- linting and code support (including various copilots) inside and IDE or text editor
- using all the more programming languages facilities; async calls, functions, data structures, and more
What’s the deal with docker
I mention earlier that having docker could be nice. This is because
when running pipelines we are bound to the proprietary runners offered
to us by 3rd party vendors such as GitHub, GitLab, but also tools like
Jenkins mandate their own syntax and integration points.
Wouldn’t it be cool if we could run the whole pipeline anywhere with
reproducibility guarantees? For this to happen we need a standard way of
executing pipeline jobs and steps/tasks. Here is where docker comes
in.
Instead of running all pipeline steps in a proprietary runner format, we just need to run one step to hook into the runner’s execution environment and let the containerized environment do the rest.
What is dagger and how it can help
Sadly, dagger has nothing to do with beautiful blades but more do to with DAG (Directed acyclic graph).
So less of a:

And more like:
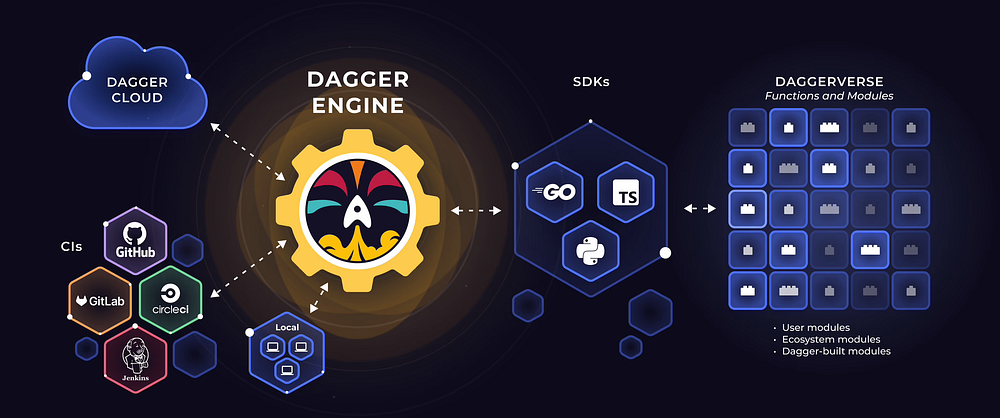
Transform your Messy CI Scripts into Clean Code
Powerful, programmable open source CI/CD engine that runs your pipelines in containers — pre-push on your local machine and/or post-push in CI
Let’s convert a pipeline
We are going to convert an actual python pipeline of one of my projects killercoda-cli which is a simple Python CLI helping with writing killercoda.com scenarios. The goal is to convert just the right amount of steps and introduce dagger gradually to the project.
The pipeline builds the CLI, runs tests and enables manual push to PyPi registry.
https://github.com/Piotr1215/killercoda-cli/blob/main/.github/workflows/ci.yml
First things first; prerequisites
Before we start, we need to install dagger CLI and docker (podman and nerdctl would work too).
I’m using Linux, so curl will do just fine (with modified path to save
the binary to):
curl -L https://dl.dagger.io/dagger/install.sh | BIN_DIR=/usr/local/bin sh
The installation script instructs me how to add completion; executing
dagger completion zsh > /usr/local/share/zsh/site-functions/_dagger
and after reloading zshrc tab completion works just fine:
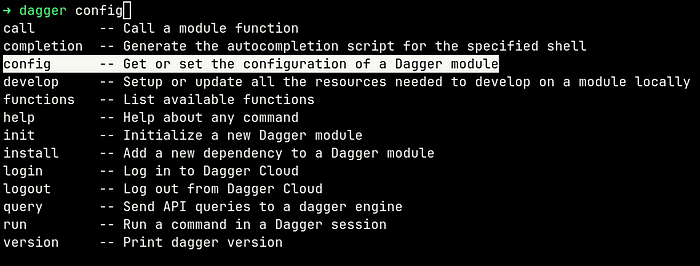
Adding dagger to the project
Running dagger init --sdk=python pulled dagger image, created a
dagger directory and dagger.json file.
dagger
├── pyproject.toml
├── requirements.lock
├── sdk
│   ├── codegen
│   │   ├── pyproject.toml
│   │   ├── requirements.lock
│   │   └── src
│   │       └── codegen
│   │           ├── cli.py
│   │           ├── generator.py
│   │           ├── __init__.py
│   │           └── __main__.py
│   ├── LICENSE
│   ├── pyproject.toml
│   ├── README.md
│   └── src
│       └── dagger
│           ├── client
│           │   ├── base.py
│           │   ├── _core.py
│           │   ├── gen.py
│           │   ├── _guards.py
│           │   ├── __init__.py
│           │   └── _session.py
│           ├── _config.py
│           ├── _connection.py
│           ├── _engine
│           │   ├── conn.py
│           │   ├── download.py
│           │   ├── __init__.py
│           │   ├── progress.py
│           │   ├── session.py
│           │   └── _version.py
│           ├── _exceptions.py
│           ├── __init__.py
│           ├── log.py
│           ├── _managers.py
│           ├── mod
│           │   ├── _arguments.py
│           │   ├── cli.py
│           │   ├── _converter.py
│           │   ├── _exceptions.py
│           │   ├── __init__.py
│           │   ├── _module.py
│           │   ├── _resolver.py
│           │   ├── _types.py
│           │   └── _utils.py
│           ├── py.typed
│           └── telemetry
│               ├── attributes.py
│               └── __init__.py
└── src
    └── main
        └── __init__.py

12 directories, 42 files
{
  "name": "killercoda-cli",
  "sdk": "python",
  "source": "dagger",
  "engineVersion": "v0.11.7"
}
Build Environment Container
Let’s add a function to the src->main->__init__.py to create a
development environment to build and test our project.
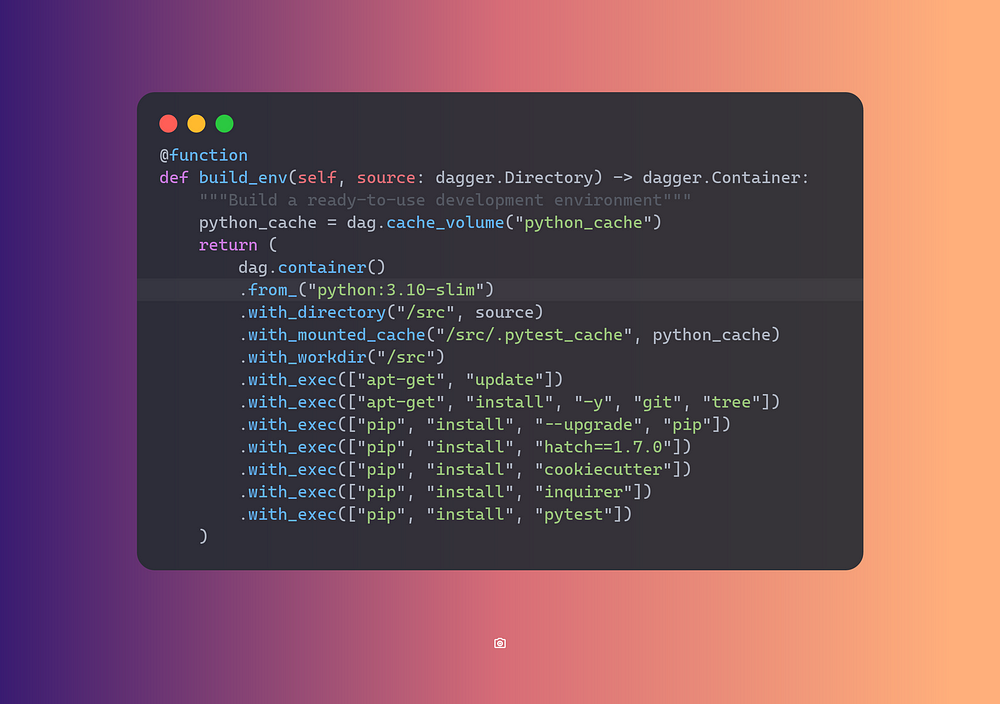
This function builds an environment with all the dependencies required by my application.
We can run it dagger call build-env — source=. and build an image.
💡Notice the kebab-case naming convention in the CLI,
build_envbecomesbuild-env
Earlier, we discussed local debugging and testing. Well, this is a container, so we should be able to drop into it with a shell!
➜ dagger call build-env --source=. terminal --cmd=bash
root@grt1fshu1uc6c:/src# ls -lah
total 2.1M
drwxr-xr-x 14 root root 4.0K Jun 13 16:21 .
drwxr-xr-x  1 root root 4.0K Jun 13 16:23 ..
-rw-rw-r--  2 root root 1.3M May 26 20:39 .aider.chat.history.md
-rw-rw-r--  2 root root  23K May 26 20:39 .aider.input.history
drwxr-xr-x  2 root root 4.0K May 26 20:39 .aider.tags.cache.v3
-rw-r--r--  2 root root  52K Jun 13 14:00 .coverage
-rw-rw-r--  2 root root  116 Feb 10 19:36 .coveragerc
drwxrwxr-x  9 root root 4.0K Jun 13 16:21 .git
drwxrwxr-x  3 root root 4.0K Feb 10 11:44 .github
-rw-rw-r--  2 root root 3.4K Feb 10 11:34 .gitignore
drwxr-xr-x  6 root root 4.0K Jun 13 12:55 .pytest_cache
drwxrwxr-x  4 root root 4.0K Jun 13 13:58 .venv-test
-rw-rw-r--  2 root root 1.1K Feb 10 11:39 LICENSE.txt
-rw-rw-r--  2 root root 5.4K Jun 13 16:17 README.md
drwx------  2 root root 4.0K Jun 13 14:51 _media
drwxrwxr-x  2 root root 4.0K May 31 11:38 assets
-rw-rw-r--  2 root root    0 Jun 13 14:44 costam.log
-rw-rw-r--  2 root root 6.4K May 26 14:42 coverage.xml
drwxr-xr-x  4 root root 4.0K Jun 13 14:45 dagger
-rw-r--r--  2 root root  102 Jun 13 12:40 dagger.json
drwxrwxr-x  2 root root 4.0K Feb 10 20:21 dist
drwxrwxr-x  3 root root 4.0K May 31 11:32 killercoda_cli
-rw-rw-r--  2 root root 686K Jun 13 14:47 output.txt
-rw-rw-r--  2 root root 2.5K Jun 13 14:15 pyproject.toml
drwxrwxr-x  2 root root 4.0K May 31 11:08 temp_template
drwxrwxr-x  4 root root 4.0K Jun 13 14:03 tests
root@grt1fshu1uc6c:/src#
Being able to locally check the container is a game changer. Remember, the same will run on a remote runner VM.
Running Tests
One more function for running tests, notice how we execute the
build_environment function before running tests.
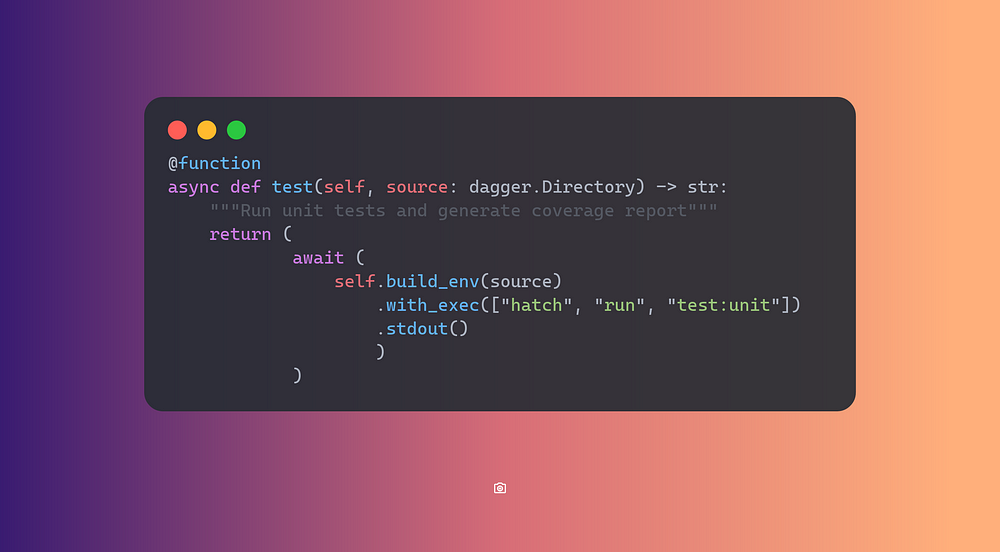
➜ dagger call test --source=.
Current directory: /tmp/test_generate_assets/killercoda-assets
Source directory: /tmp/test_generate_assets/killercoda-assets
Generating assets from template: https://github.com/Piotr1215/cookiecutter-killercoda-assets
Output directory: /tmp/test_generate_assets
Assets generated successfully.
Tests pass however outpout is a bit sparse, earlier we have setup tab
completion, let’s see if there are any flags that can help us dagger call test — source=. <TAB>
➜ dagger call test --source=. --debug
--debug     -- show debug logs and full verbosity
--json      -- Present result as JSON
--mod       -- Path to dagger.json config file for the module or a directory containing that file. Either local path (e.g. "/path/to/some/dir") or a github repo (e.g. "github.com/dagger/dagger/path/to/some/subdir")
--output    -- Path in the host to save the result to
--progress  -- progress output format (auto, plain, tty)
--silent    -- disable terminal UI and progress output
--verbose   -- increase verbosity (use -vv or -vvv for more)
The debug option gives us full run logs with max verbosity, great!
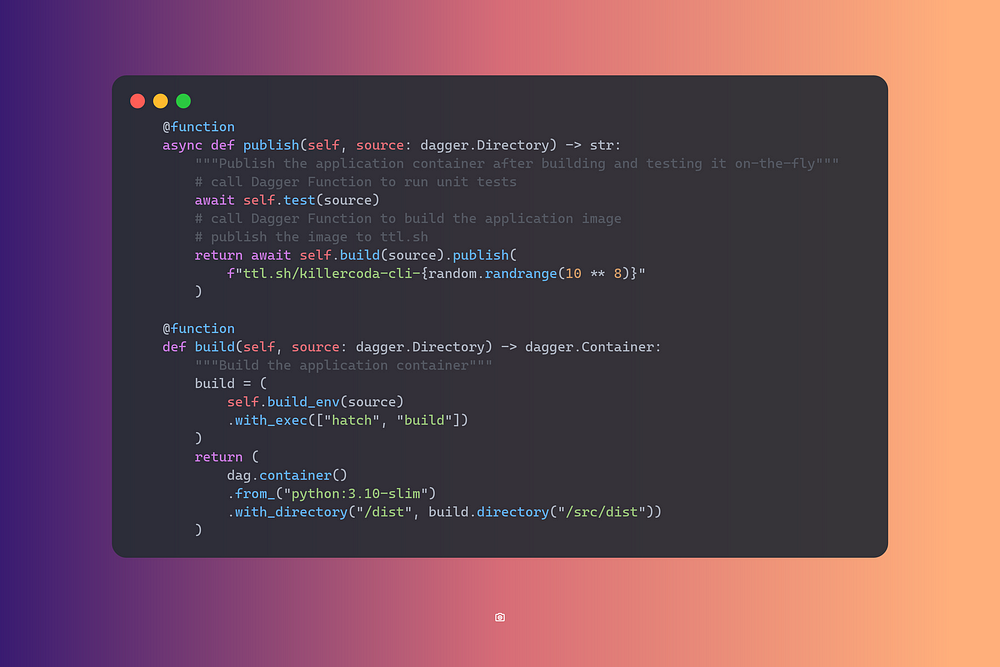
Build & Publish
The last two functions are publish and build. Publish is going to
use the awesome ttl.sh service, which allows for
publishing short-lived images (max 24h) and is great for testing. Build
will perform a multistaged build and get our application ready for
deployment.
➜ dagger call publish --source=.
ttl.sh/killercoda-cli-15186746@sha256:6d2e22543154fff996e3d829450953981c60aba6f161477e5aa3e00d3faaa2cb
Integrate with GitHub Actions
The integration with GitHub Actions is easy, just add the action to YAML workflow and call any dagger function
- name: Hello
  uses: dagger/dagger-for-github@v5
  with:
    verb: call
    args: call publish --source=.
Closing Thoughts
Integrating dagger into my GitHub Actions workflow wasn’t super easy, but it was way easier than dealing with pure YAML. The ability to adapt only parts of the workflow is great, no need for all-or-nothing rewrites; small, incremental steps are just fine.
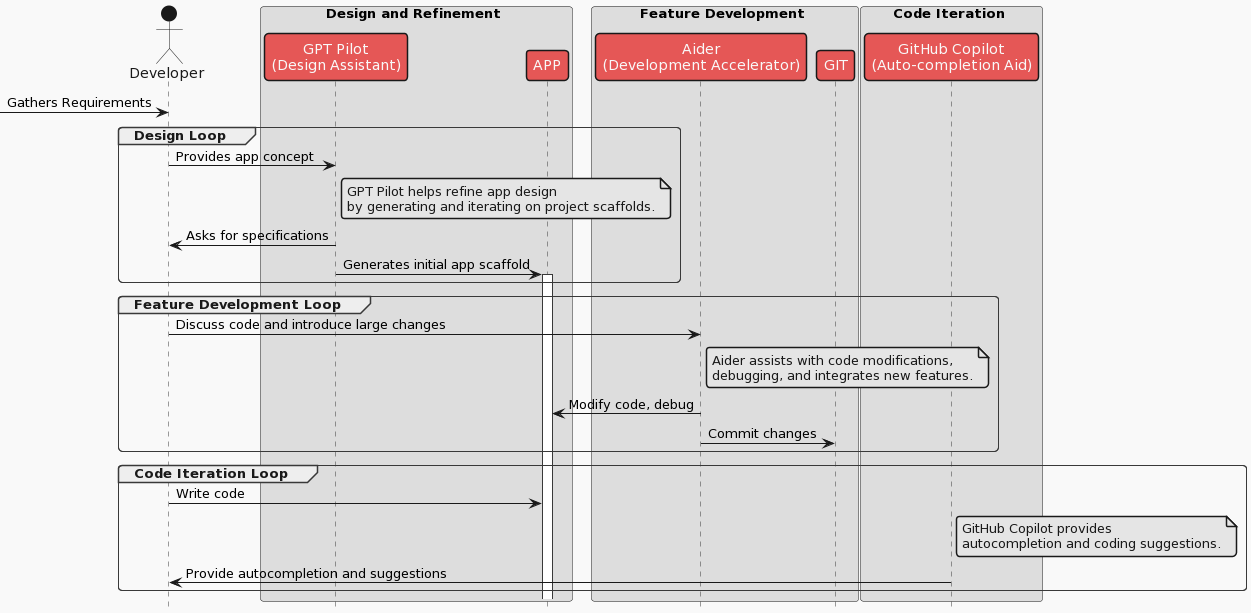
From a high level, the below diagram shows working with dagger locally and in a remote environment.
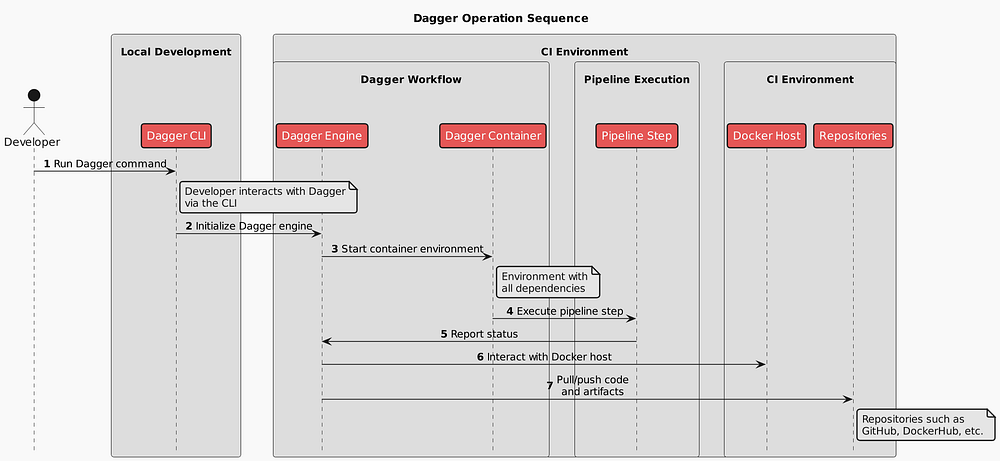
A bit win, in my opinion, is that if tomorrow I will decide to move to GitLab, I can do it much easier. Instead of migrating the whole pipeline, I keep it as is and migrate only the entry-point.
With the right amount of abstractions and clever reuse of the docker engine, dagger is a very strong choice for any pipeline. The community can collaborate on functions and capture best practices, which are available on daggerverse.
Give dagger a try and let me know what are your experiences.
Thanks for taking the time to read this post. I hope you found it interesting and informative.
🔗 Connect with me on LinkedIn
🌐 Visit my Website
📺 Subscribe to my YouTube Channel
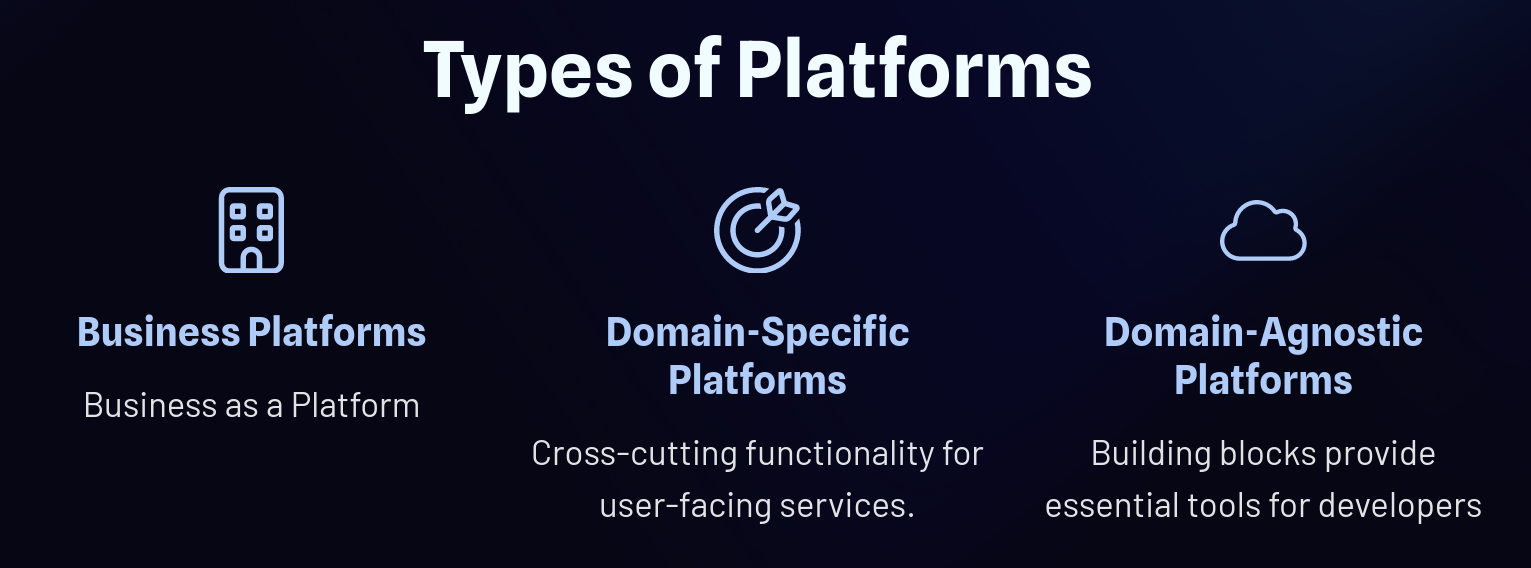 Platform Types
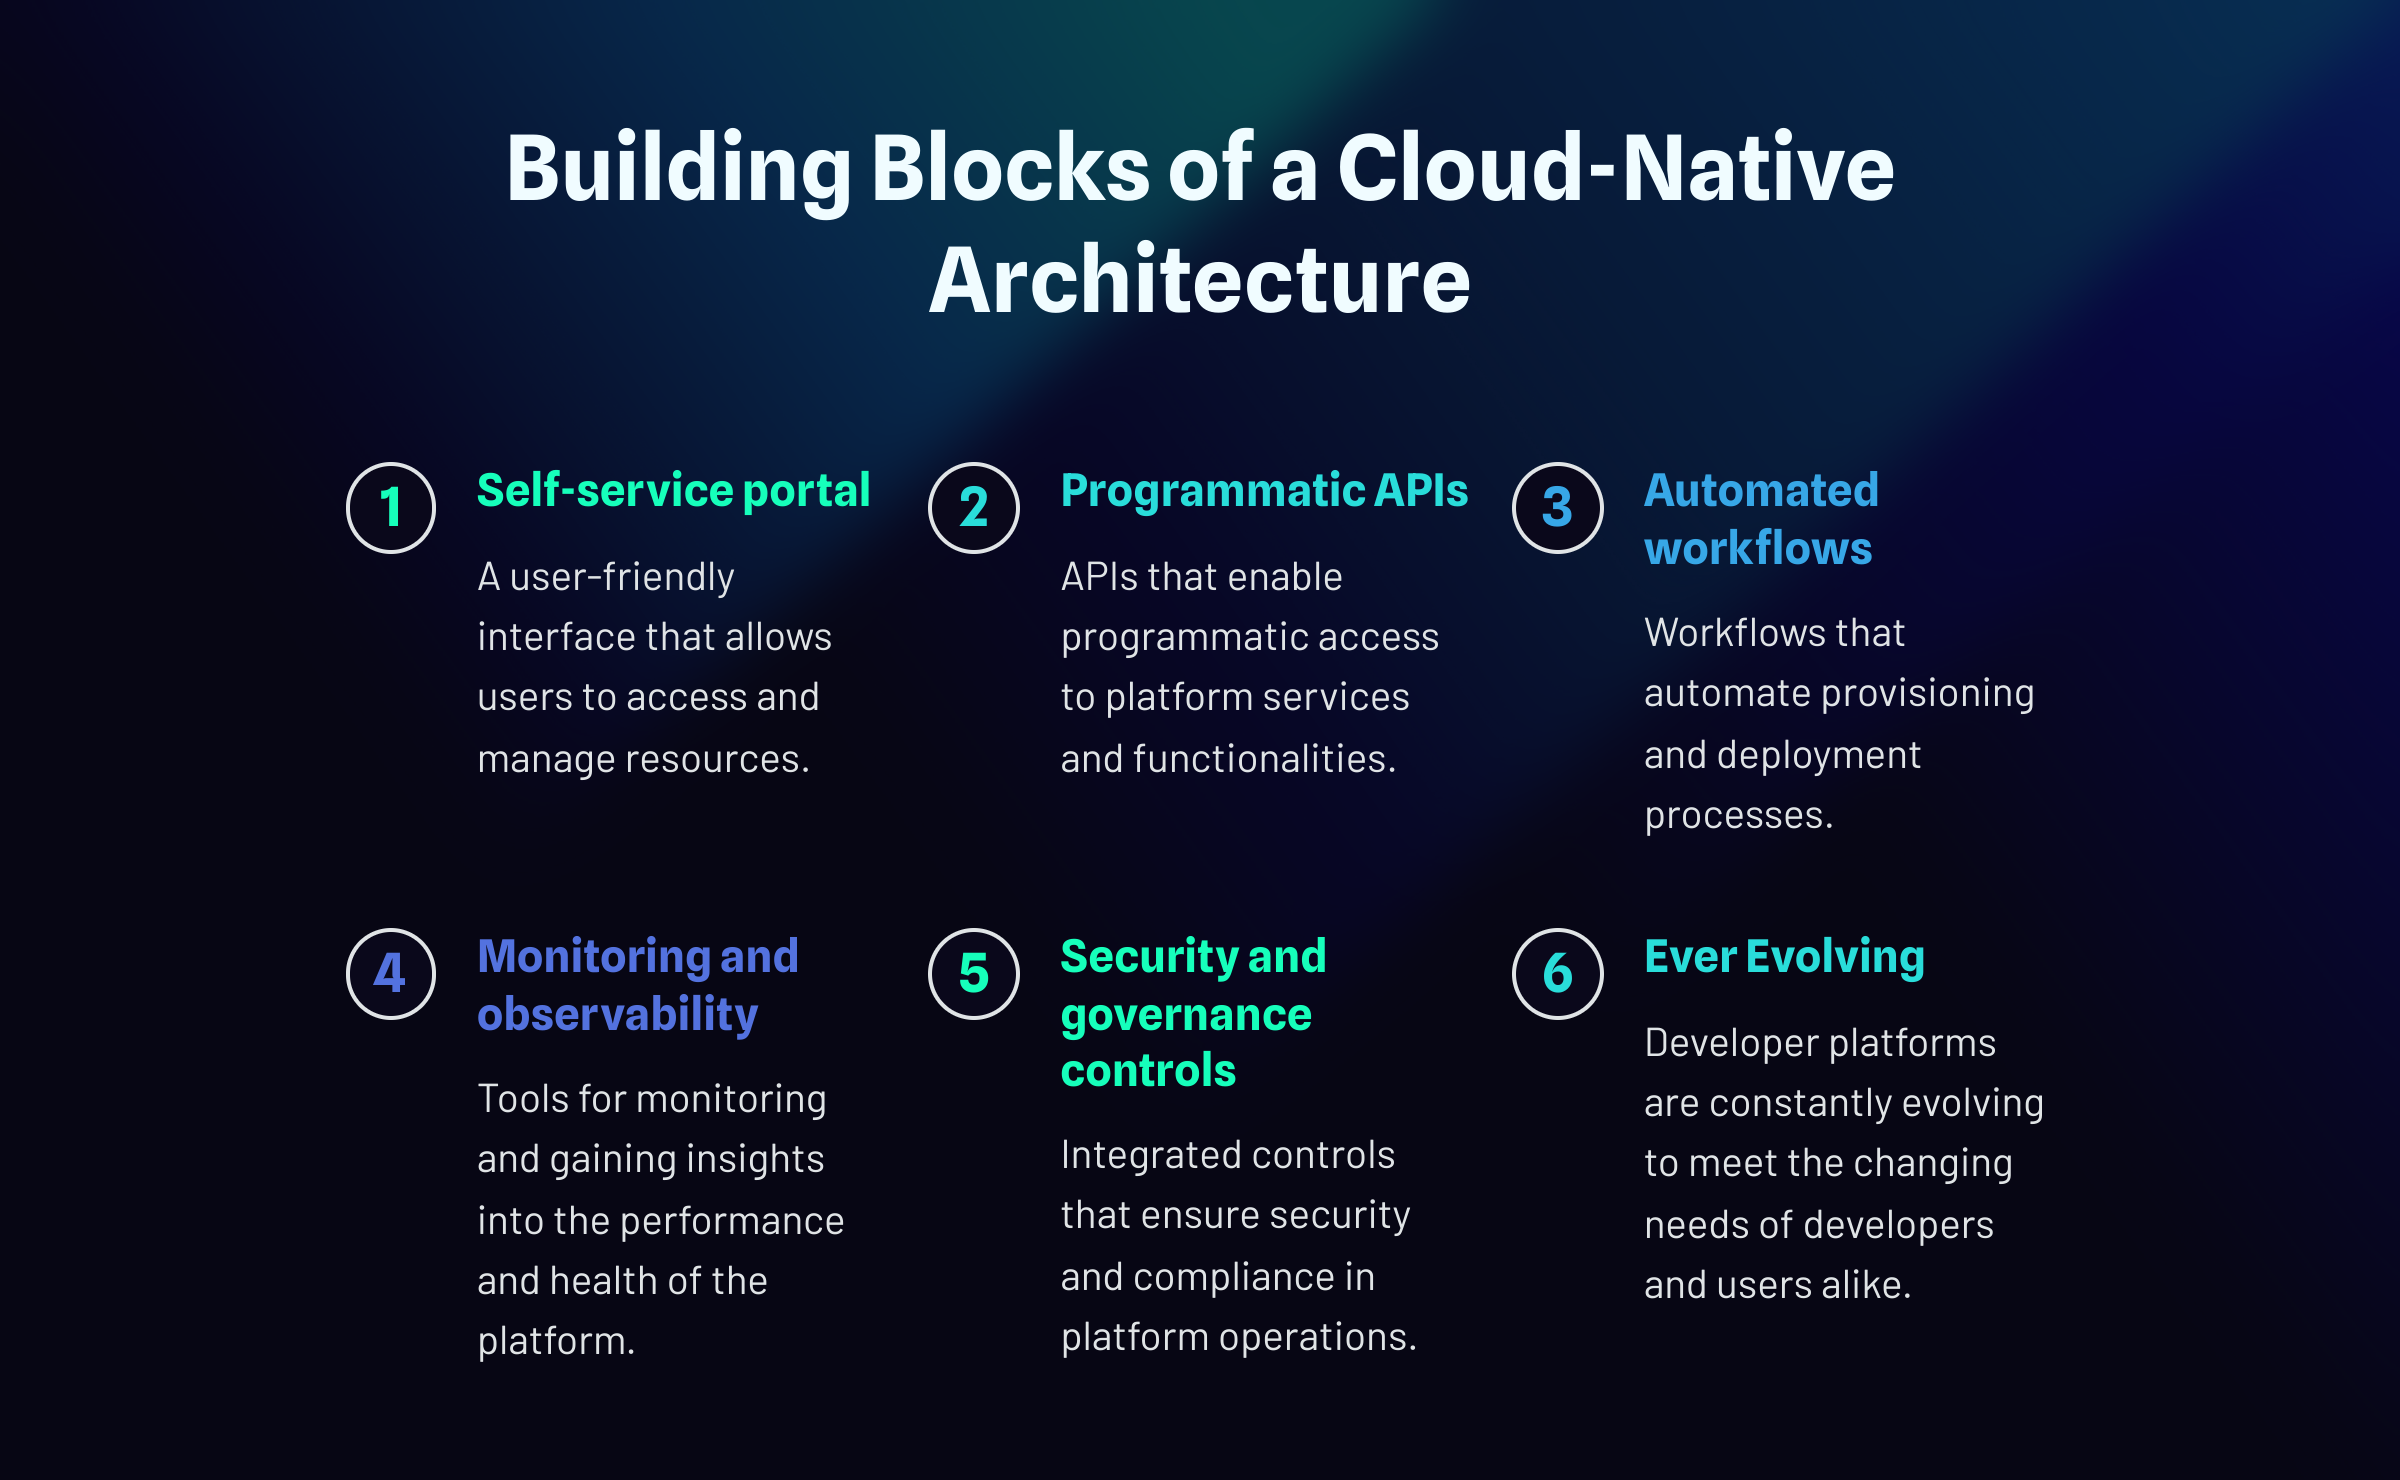 Building Blocks of Cloud-Native Platforms
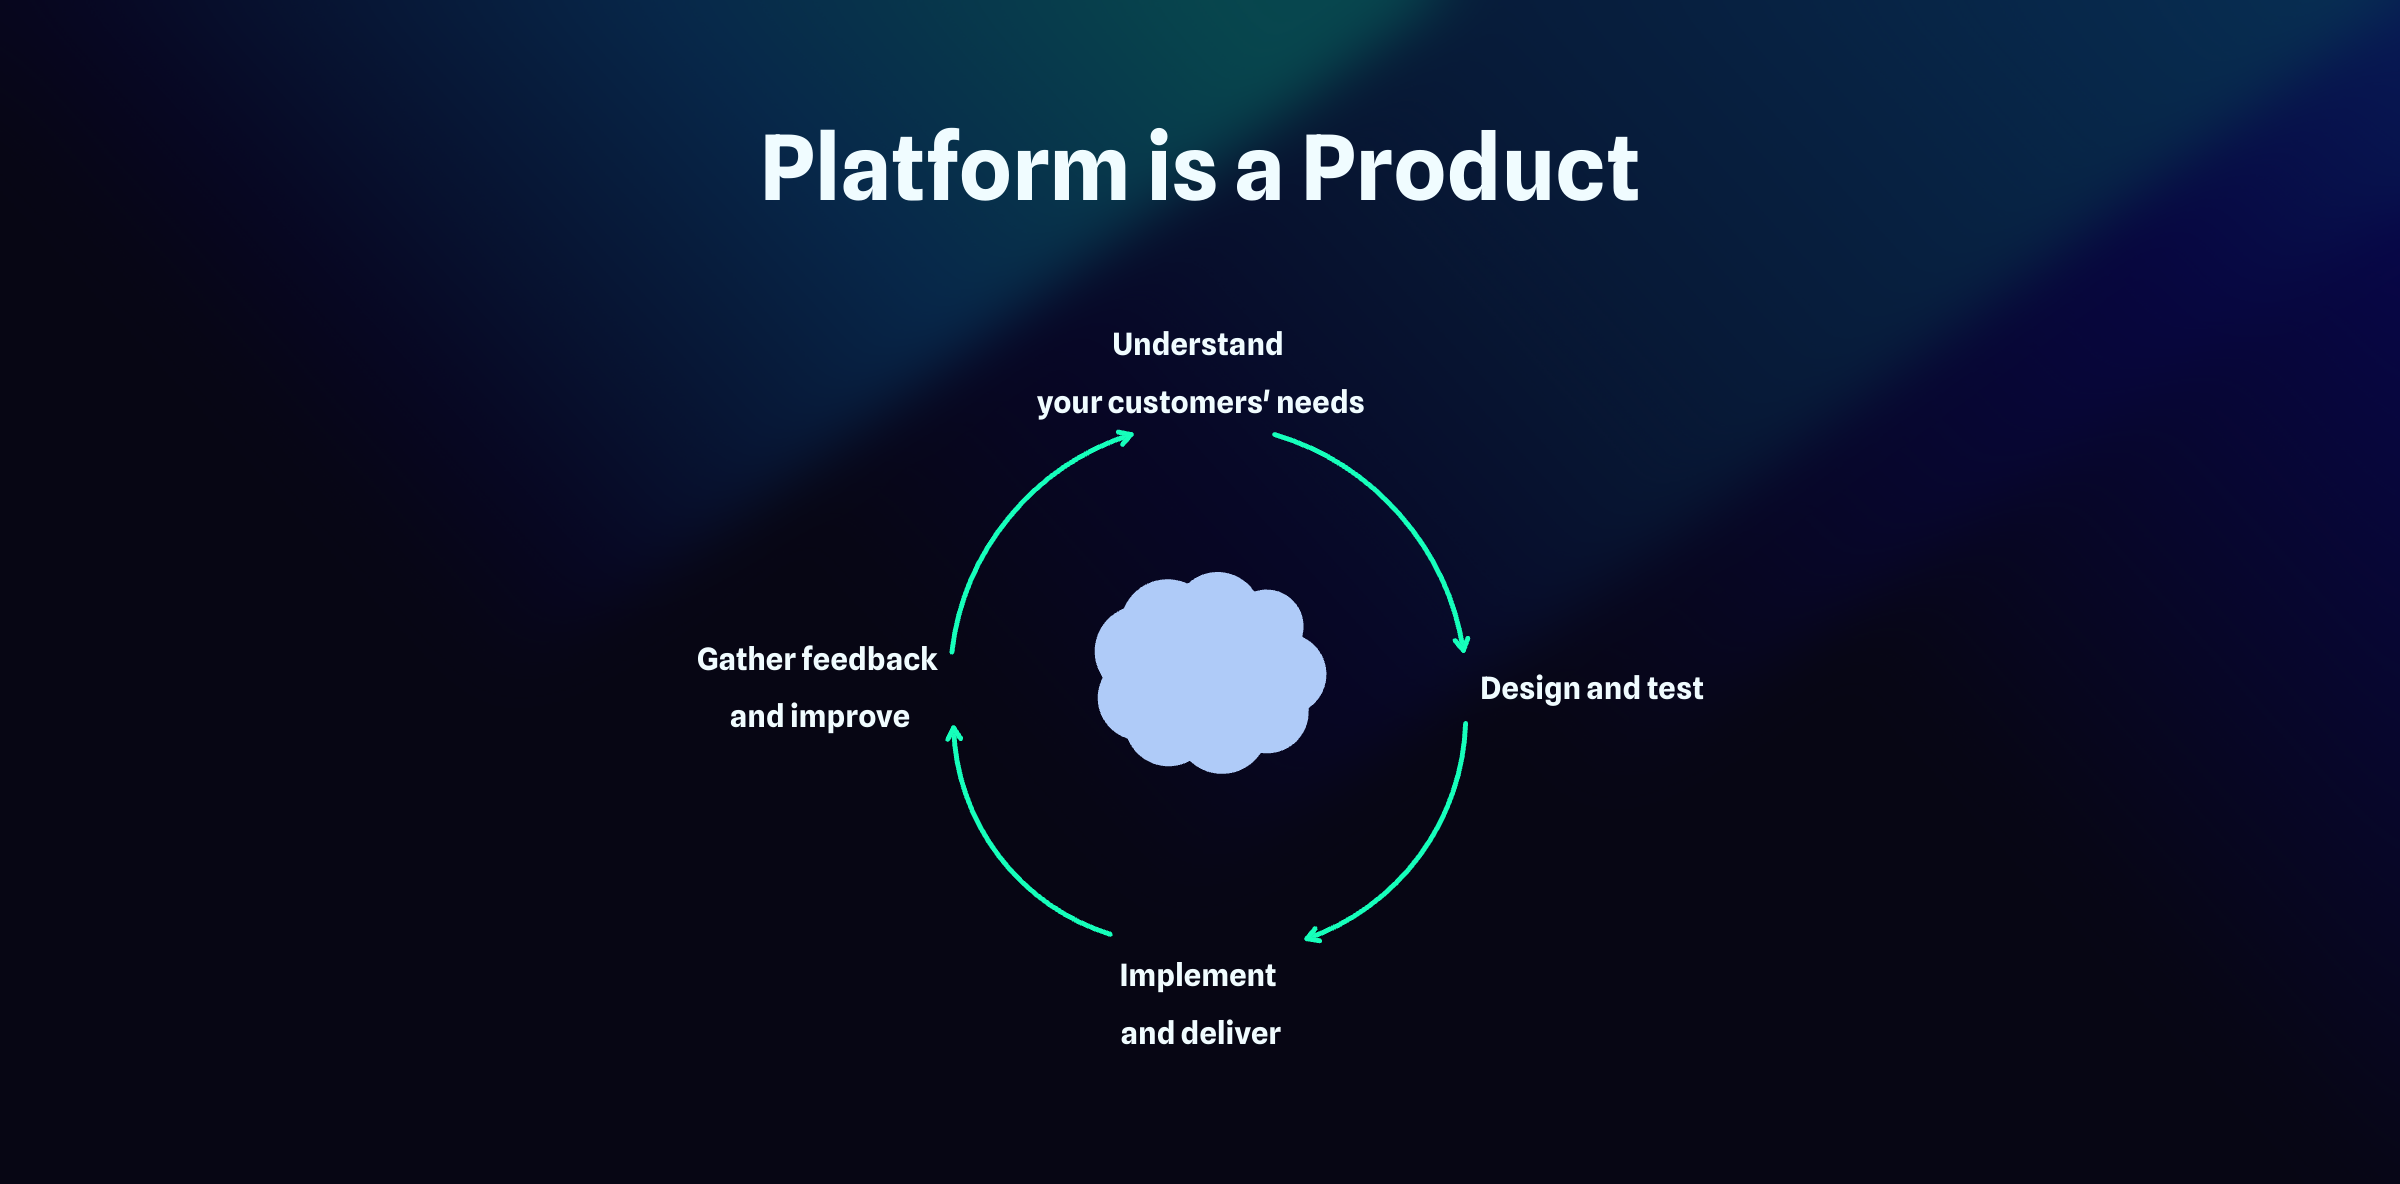 Platform as a Product
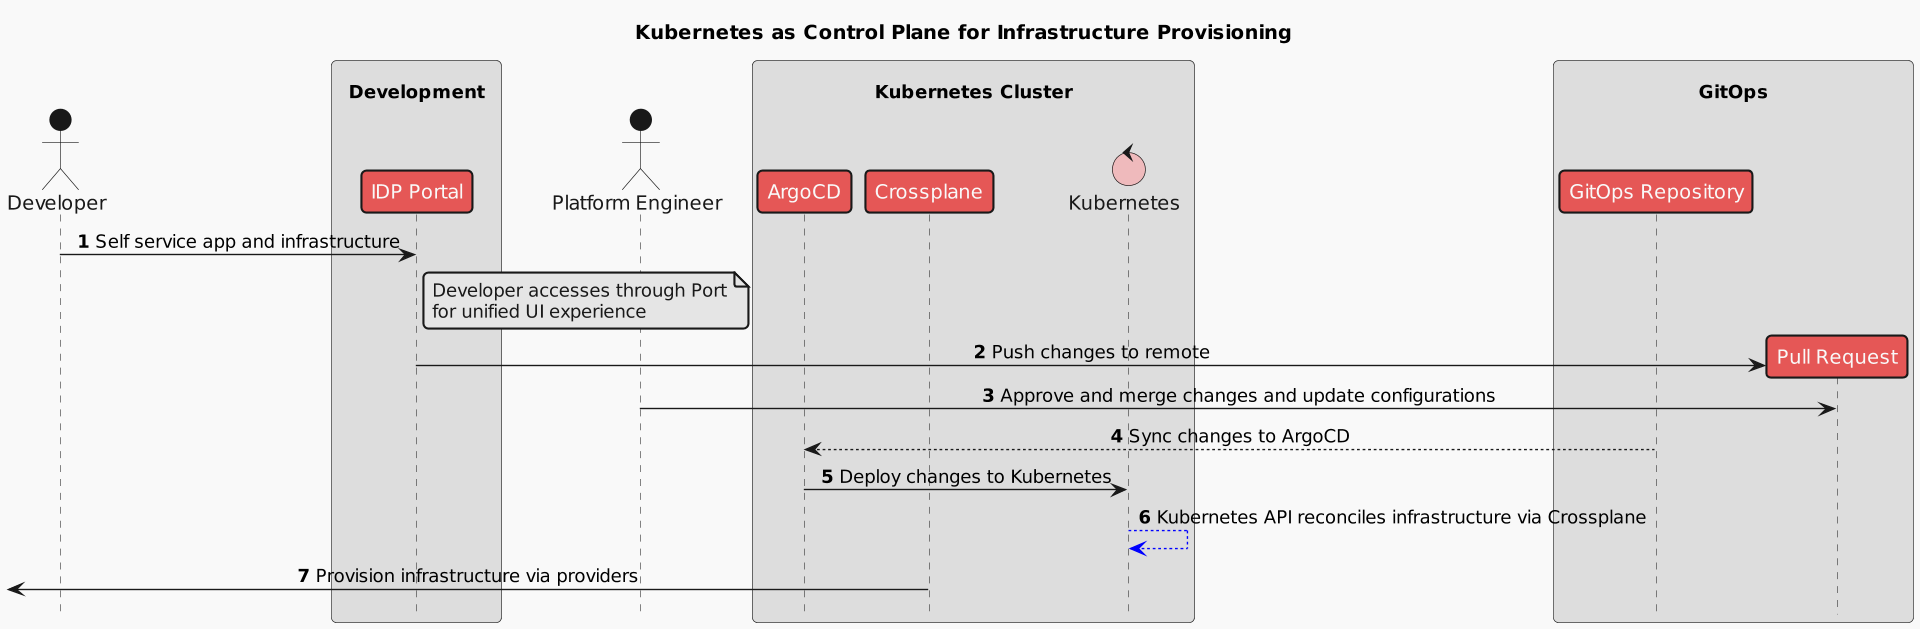


 interactive
scenario
interactive
scenario source:

 with the following code: